World Inequality

World Inequality
Who Owns the Gains?
The richest tenth of the world's adults own about three quarters of its personal wealth. The poorest half own about two per cent. Between those figures lies a difference that income alone cannot capture: the difference between receiving a wage and owning something that can provide an income, secure a loan or be passed to a child. The World Inequality Report 2026 presents these as estimates for 2025, partly extended from earlier data. Their value is in showing the scale of concentrated ownership, rather than recording a sudden change in one year. [1]
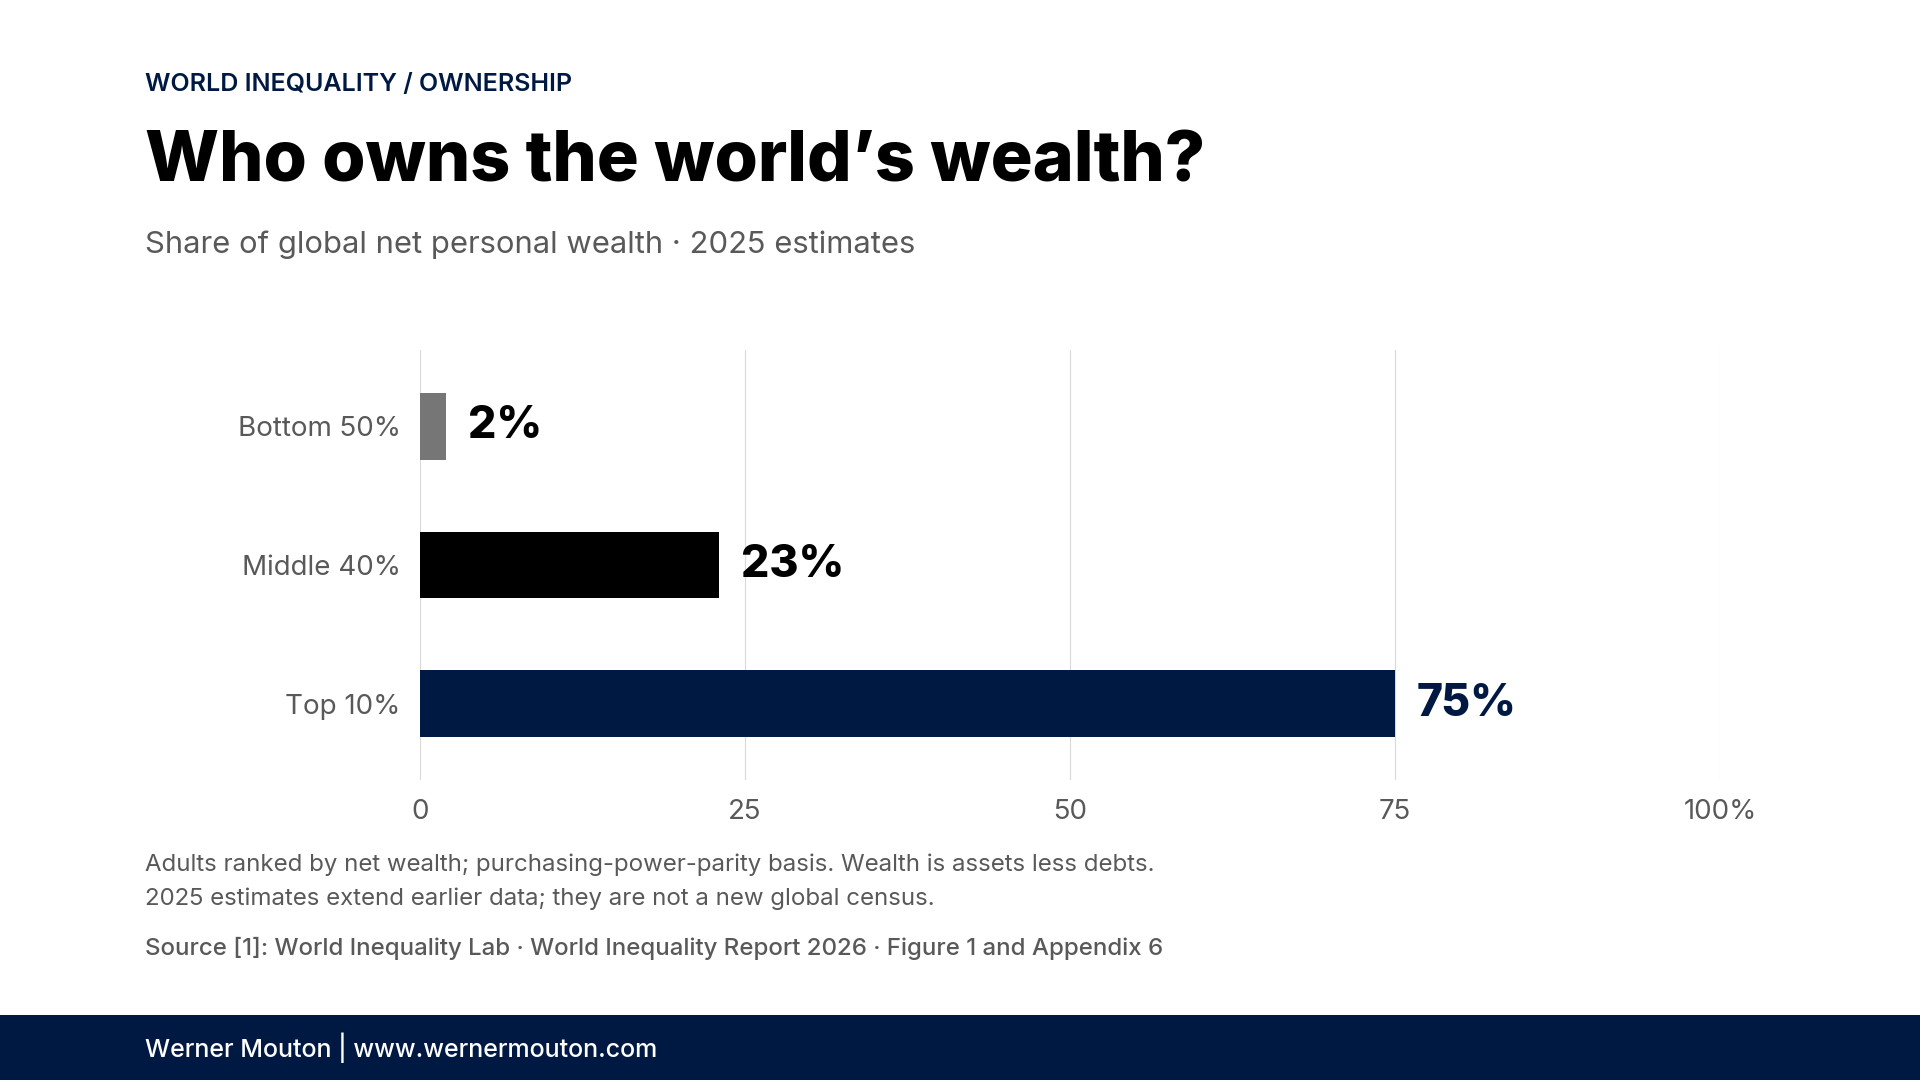
The richest tenth of the world's adults own about three quarters of its personal wealth.
This concentration has survived a period of substantial material progress. Large populations have escaped extreme poverty, and poorer countries have narrowed some of the income gaps separating them from richer ones. These gains complicate the claim that the world economy has failed everyone outside a small elite. But they do not settle the question of inequality. An economy can raise living standards while leaving ownership concentrated and workers dependent on institutions they have little power to shape. The question is how far growth changes that dependence, and whether those who produce more acquire a stronger claim on what they produce. [5][8][10][15]
China provides the strongest reason to take growth seriously. A joint World Bank and Chinese government research report estimated that nearly 800 million people moved above the older international extreme poverty line of $1.90 per person per day over four decades. Agricultural reform raised output, industry drew workers into better paid employment, and infrastructure connected production to expanding markets. The scale of this change helped reduce global income inequality: Branko Milanovic's research finds a substantial decline between around 2000 and 2018 as poorer populations gained ground. A history concerned only with the fortunes accumulated at the top would miss an improvement in millions of ordinary lives. [5][8]
Yet China's experience offers little comfort to the belief that prosperity follows when governments simply withdraw. Public investment, state capacity and earlier gains in health and education formed part of the conditions under which markets expanded. Nor does the experience suggest that redistribution could have replaced agricultural productivity, industrial employment or the construction of infrastructure. Production and public action worked together. The difficult task is to explain how they did so, rather than award the entire achievement to either the market or the state. [8]
The same expansion also imposed losses elsewhere. David Autor, David Dorn and Gordon Hanson found persistent damage to employment and incomes in American communities exposed to Chinese import competition. Their research does not measure the worldwide balance of benefits and costs, but it undermines the assumption that workers and places adjust quickly when production moves. Cheaper goods do not restore a lost wage, and a national gain does not tell us whether the people bearing the costs received compensation. Growth changes where income is earned. Governments still have to decide what obligations follow when those changes leave communities behind. [23]
Within growing economies, ownership can remain narrow. Researchers at the World Inequality Lab estimate that India's richest one per cent received 22.6 per cent of income and owned 40.1 per cent of wealth in 2022–23. The precise shares depend on incomplete records and assumptions about resources missing from them; the wider finding is that rising national income did not automatically spread ownership. That distinction matters because assets carry benefits beyond current spending. A home can reduce dependence on rent, savings can absorb a period without work, and business ownership can provide income that does not depend solely on hours worked. [15][17]
Labour also has to secure its share of growth. The International Labour Organization finds that wage inequality fell in a majority of the countries it could compare, an improvement that should temper claims of universal deterioration. But this measures differences among wage earners. It does not establish that workers collectively gained against owners, or that people excluded from employment found work. An ILO and OECD paper reports that labour's global income share fell by 1.6 percentage points between 2004 and 2024. Lower paid workers can therefore gain on higher paid colleagues while labour receives a smaller share of total income. [9][10]
The division is shaped by both production and bargaining. Research on highly productive firms links their growing weight in the economy to falling labour shares, while historical research on American unions finds evidence that collective organisation reduced income inequality, particularly for workers with fewer skills. Neither finding supplies a complete explanation. Together they show why wages cannot be understood as a simple measure of individual effort: technology and business scale affect what firms produce, and bargaining institutions affect what workers receive. The rules governing employment help determine whether greater productivity becomes higher pay. [11][12]
For many households, however, inequality begins before anyone reaches the bargaining table. The World Bank's assessment of Southern Africa identifies unemployment, inherited circumstances and unequal access to land, skills and productive assets as major sources of inequality. In South Africa, race remains closely tied to unequal opportunity. A government can spend heavily on social programmes and still struggle to overcome differences in school quality and access to employment. Transfers can ease hardship, but they cannot by themselves provide the productive assets, skills and jobs whose absence helps reproduce it. [18]
Care responsibilities further shape who can enter paid work. The ILO estimates that they kept 708 million women and 40 million men outside the labour force in 2023. Their exclusion disappears from comparisons confined to wages, even though it affects earnings, savings and prospects over a lifetime. Affordable care services can change the time available for employment, just as better schools can change the opportunities available to children. Public provision therefore affects inequality before taxes and benefits appear in the household accounts. It helps determine who can earn in the first place. [18][20]
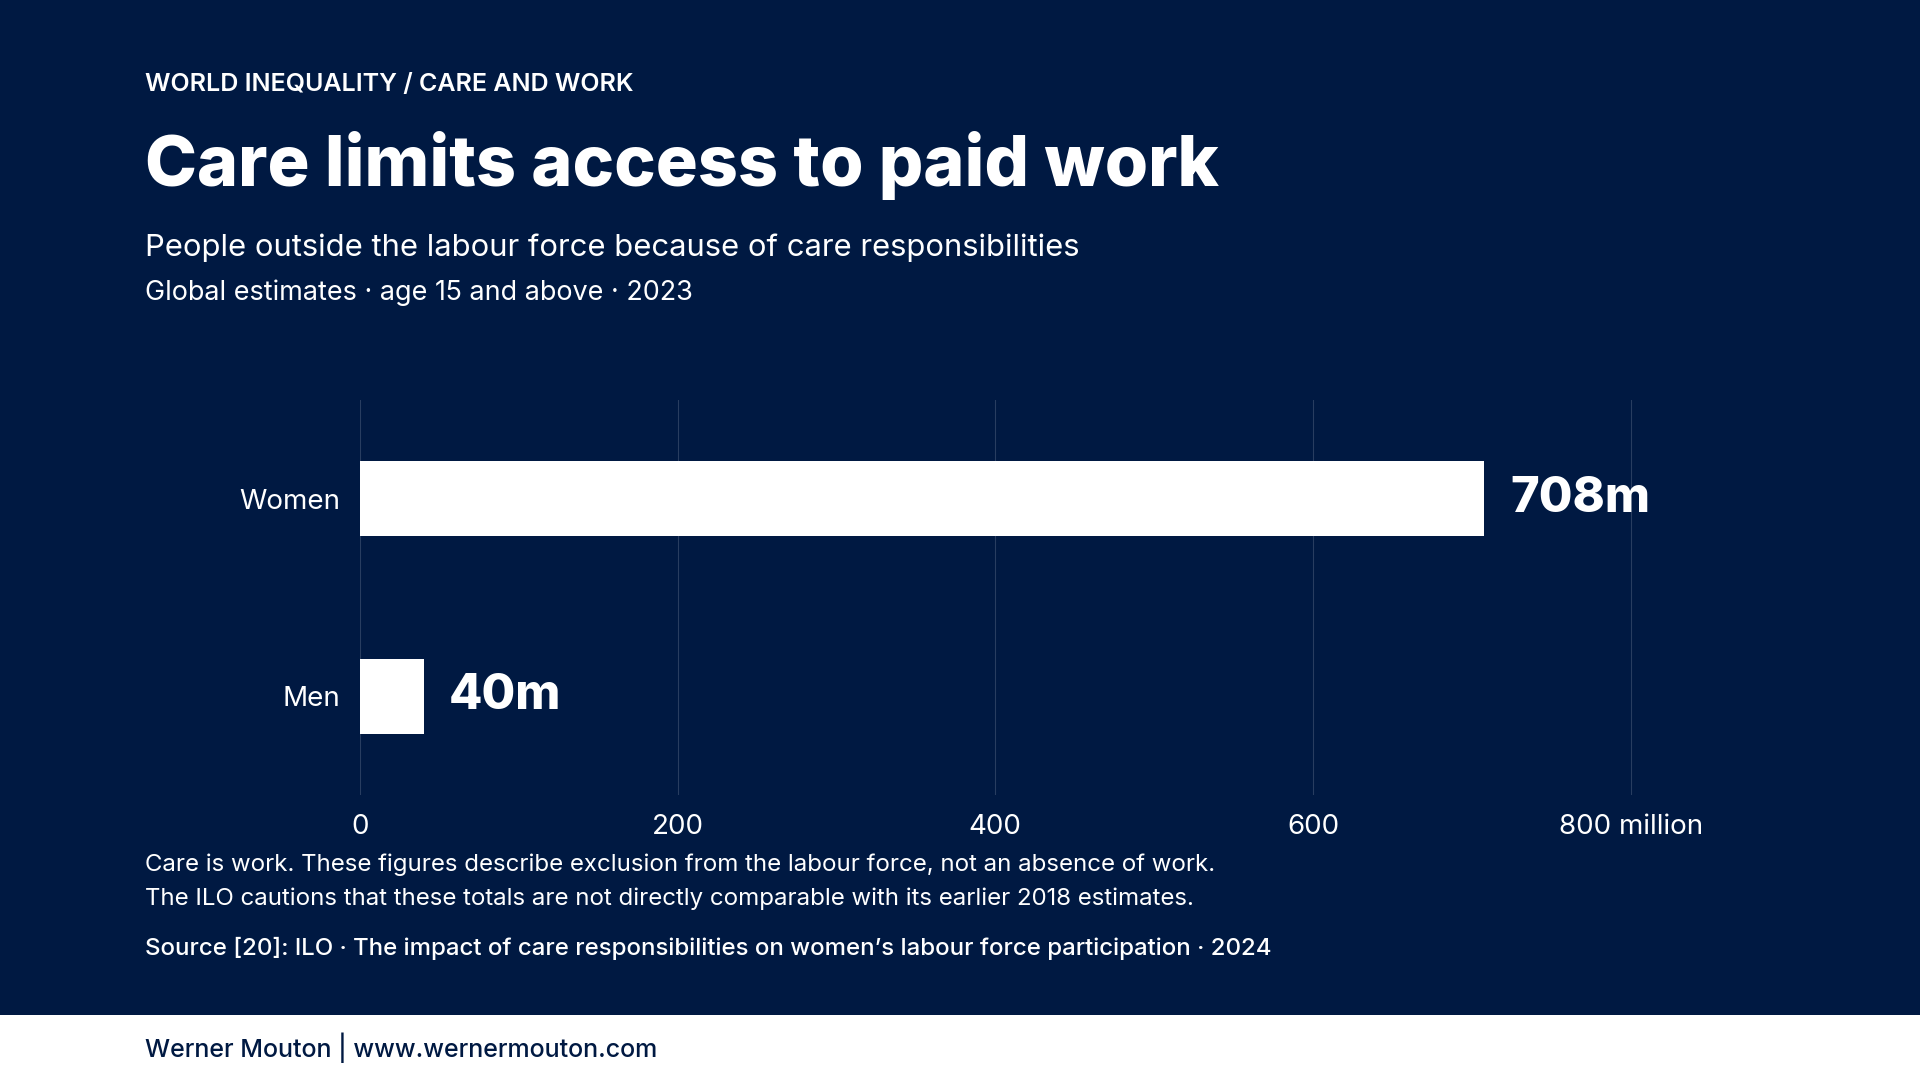
Care responsibilities
Taxes then change what households retain. The OECD reports an average inequality score of 0.46 before taxes and transfers and 0.32 after them in its comparison centred on 2021, where a lower score means less inequality. This is not an estimate of what would happen if governments abolished those systems; work, saving and household decisions would also change. But it establishes that public institutions already alter the distribution substantially. David Hope and Julian Limberg's study of major tax cuts for the rich across eighteen wealthy countries also found higher top income shares without statistically significant gains in growth or unemployment over the periods examined. The promised wider benefits cannot simply be assumed. [13][14]
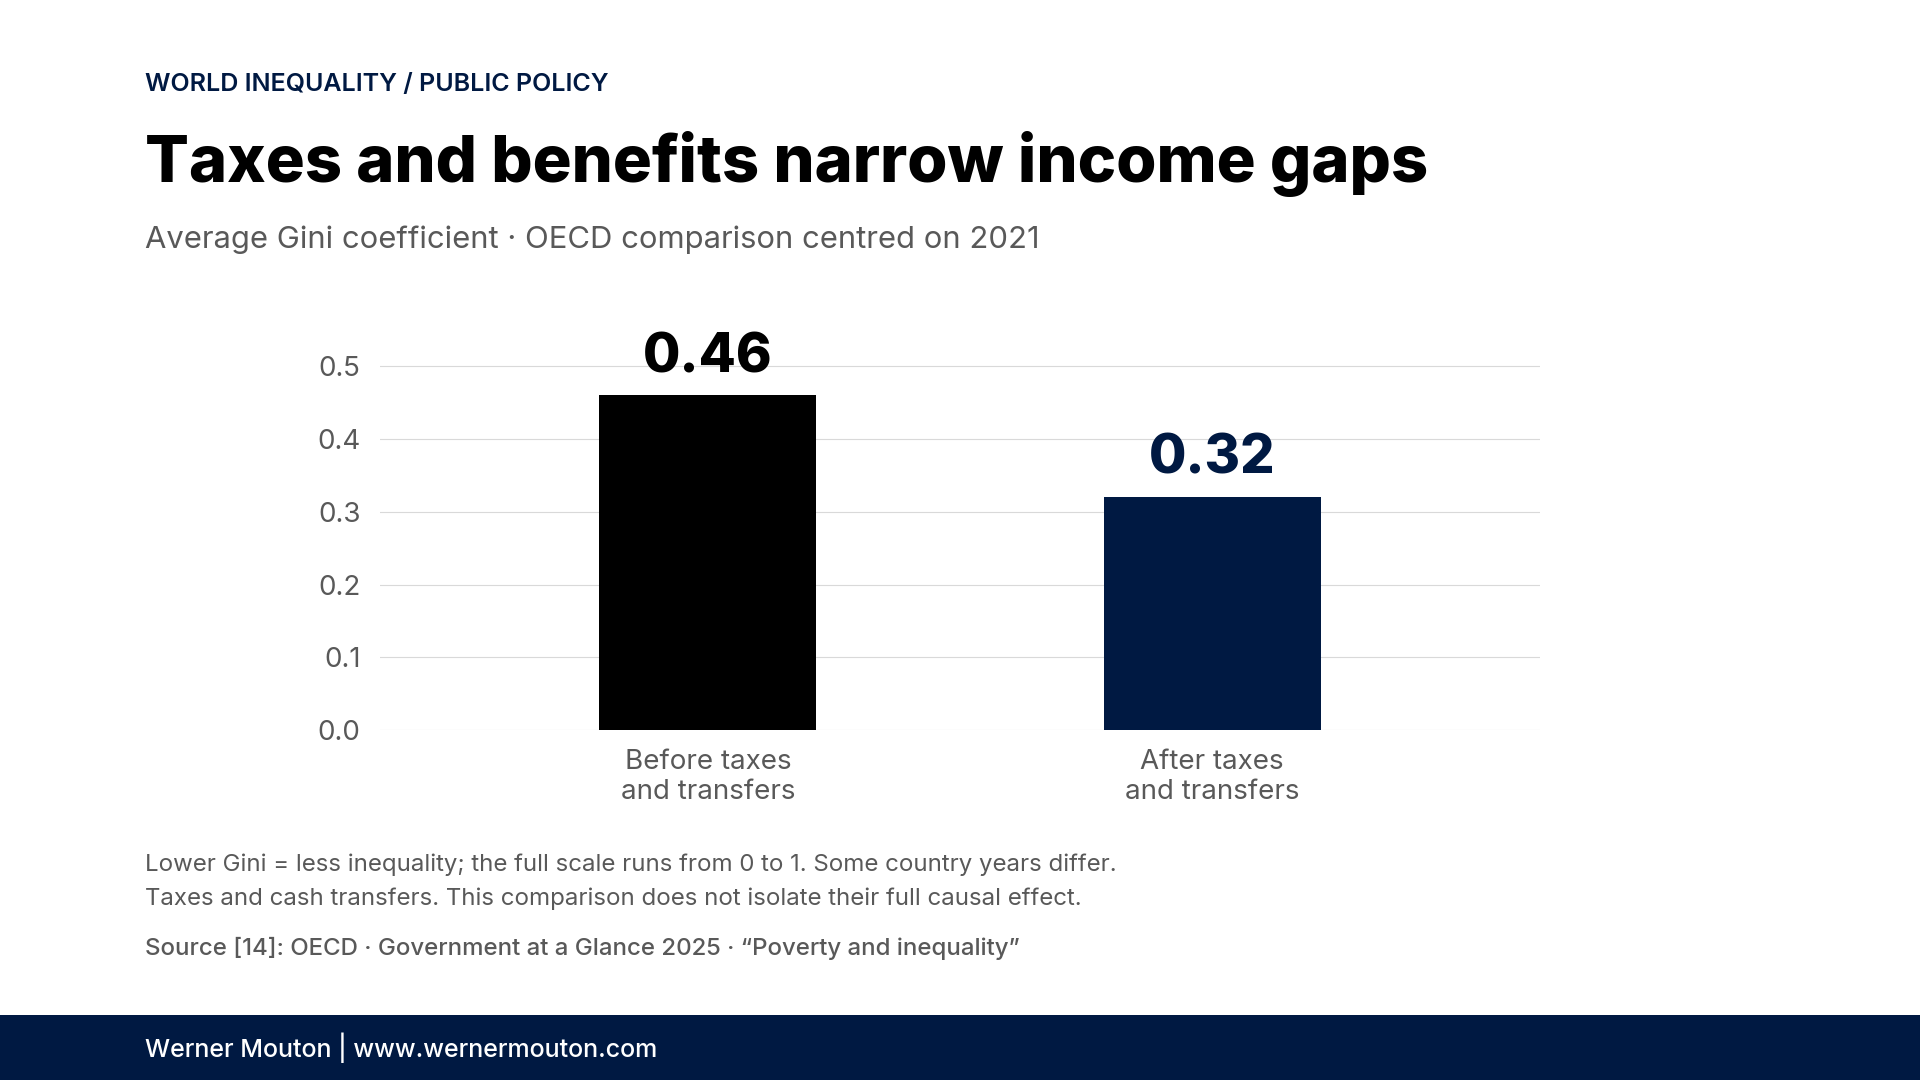
Taxes then change what households retain.
Inheritance carries these differences into the next generation. The OECD finds that wealthier households tend to receive larger gifts and bequests. A transfer can help someone buy a home or withstand lost earnings, giving the recipient choices that wages alone might not provide. Smaller inheritances can also make a substantial difference to poorer households, so their effects on measured inequality are not uniform. The broader issue is how far opportunity depends on family assets. Governments that promise equal opportunity while leaving inherited advantage untouched ask schools and labour markets to overcome differences in resources that their own tax and property rules help preserve. [15][18]
The political difficulty is that those institutions operate in societies where resources are already unequal. Martin Gilens and Benjamin Page found that affluent preferences and organised business interests had stronger independent associations with American policy outcomes than the preferences of average citizens. Their study does not prove that wealth controls every decision, and its findings cannot be applied to every democracy. It does establish a reason to question whether equal votes produce equal influence. Where wealth helps preserve favourable rules, ownership can become a means of protecting the conditions under which further wealth accumulates. That possibility makes distribution a matter of democratic power as well as household income. [24]
Governments themselves face unequal constraints. UNCTAD reports that developing countries paid $921 billion in net public debt interest in 2024, drawing attention to the pressure debt service places on public budgets. Borrowing can finance useful investment, and an interest bill alone cannot show whether a loan was wasteful or what spending would otherwise have occurred. Still, the terms of borrowing matter: expensive debt can narrow the room for schools, clinics and infrastructure. A programme for wider opportunity must therefore consider both what governments should provide and their capacity to pay for it. [21]
There is no single measure that captures all these differences, and no single reform that removes them. But the evidence supports a coherent judgment. Growth has improved lives without reliably spreading ownership or equalising influence over the rules that govern economic life. Those outcomes depend on decisions about work, taxation, inheritance and public provision. Treating growth as sufficient leaves those decisions unexamined; treating growth as irrelevant overlooks how much material improvement requires greater productive capacity. A serious politics of inequality must hold both questions together. People need higher incomes, but they also need the assets, services and bargaining power that make those incomes less precarious. The test is whether a growing economy gives more people the means to live securely and a greater say over the conditions of their lives. [8][10][14][15][18][24]
Sources
[1] World Inequality Lab. World Inequality Report 2026. 2026. See Figure 1 for global income and wealth shares and Appendix 6 for the methods used to extend estimates.
[5] Milanovic, Branko. “The Three Eras of Global Inequality, 1820–2020, with the Focus on the Past Thirty Years.”World Development, 177, 106516, 2024.
[8] World Bank and Development Research Center of the State Council, China. Four Decades of Poverty Reduction in China: Drivers, Insights for the World, and the Way Ahead. World Bank, 2022.
[9] International Labour Organization. Global Wage Report 2024–25: Is Wage Inequality Decreasing Globally?November 2024.
[10] International Labour Organization and OECD. Policy Measures to Address Inequalities and Increase the Labour Income Share. Employment Working Group paper, 8 April 2025.
[11] Autor, David, David Dorn, Lawrence F. Katz, Christina Patterson and John Van Reenen. “The Fall of the Labor Share and the Rise of Superstar Firms.” Quarterly Journal of Economics, 135(2), 2020, pp. 645–709.
[12] Farber, Henry S., Daniel Herbst, Ilyana Kuziemko and Suresh Naidu. “Unions and Inequality over the Twentieth Century: New Evidence from Survey Data.” Quarterly Journal of Economics, 136(3), 2021, pp. 1325–1385. Link leads to the revised working-paper version.
[13] Hope, David, and Julian Limberg. The Economic Consequences of Major Tax Cuts for the Rich. LSE International Inequalities Institute, Working Paper 55, 2020. Subsequently published in Socio-Economic Review, 20(2), 2022, pp. 539–559. The research report used the linked working paper.
[14] OECD. “Poverty and Inequality.” In Government at a Glance 2025. OECD Publishing, 2025.
[15] OECD. Inheritance Taxation in OECD Countries. OECD Tax Policy Studies, No. 28, 2021.
[17] Bharti, Nitin Kumar, Lucas Chancel, Thomas Piketty and Anmol Somanchi. Income and Wealth Inequality in India, 1922–2023: The Rise of the Billionaire Raj. World Inequality Lab, Working Paper 2024/09, March 2024.
[18] World Bank. Inequality in Southern Africa: An Assessment of the Southern African Customs Union. March 2022. Consulted through the official overview and findings.
[20] International Labour Organization. The Impact of Care Responsibilities on Women’s Labour Force Participation. Statistical Brief, October 2024.
[21] UN Trade and Development (UNCTAD). A World of Debt 2025. 26 June 2025. The research report used UNCTAD’s official indexed findings; the full report was inaccessible during preparation, and its underlying calculations were not independently examined.
[23] Autor, David, David Dorn and Gordon Hanson. “On the Persistence of the China Shock.” Brookings Papers on Economic Activity, Fall 2021, pp. 381–447.
[24] Gilens, Martin, and Benjamin I. Page. “Testing Theories of American Politics: Elites, Interest Groups, and Average Citizens.” Perspectives on Politics, 12(3), 2014, pp. 564–581.